2026 midterm elections SEO: who won Google Top Stories, AI Overviews and Discover


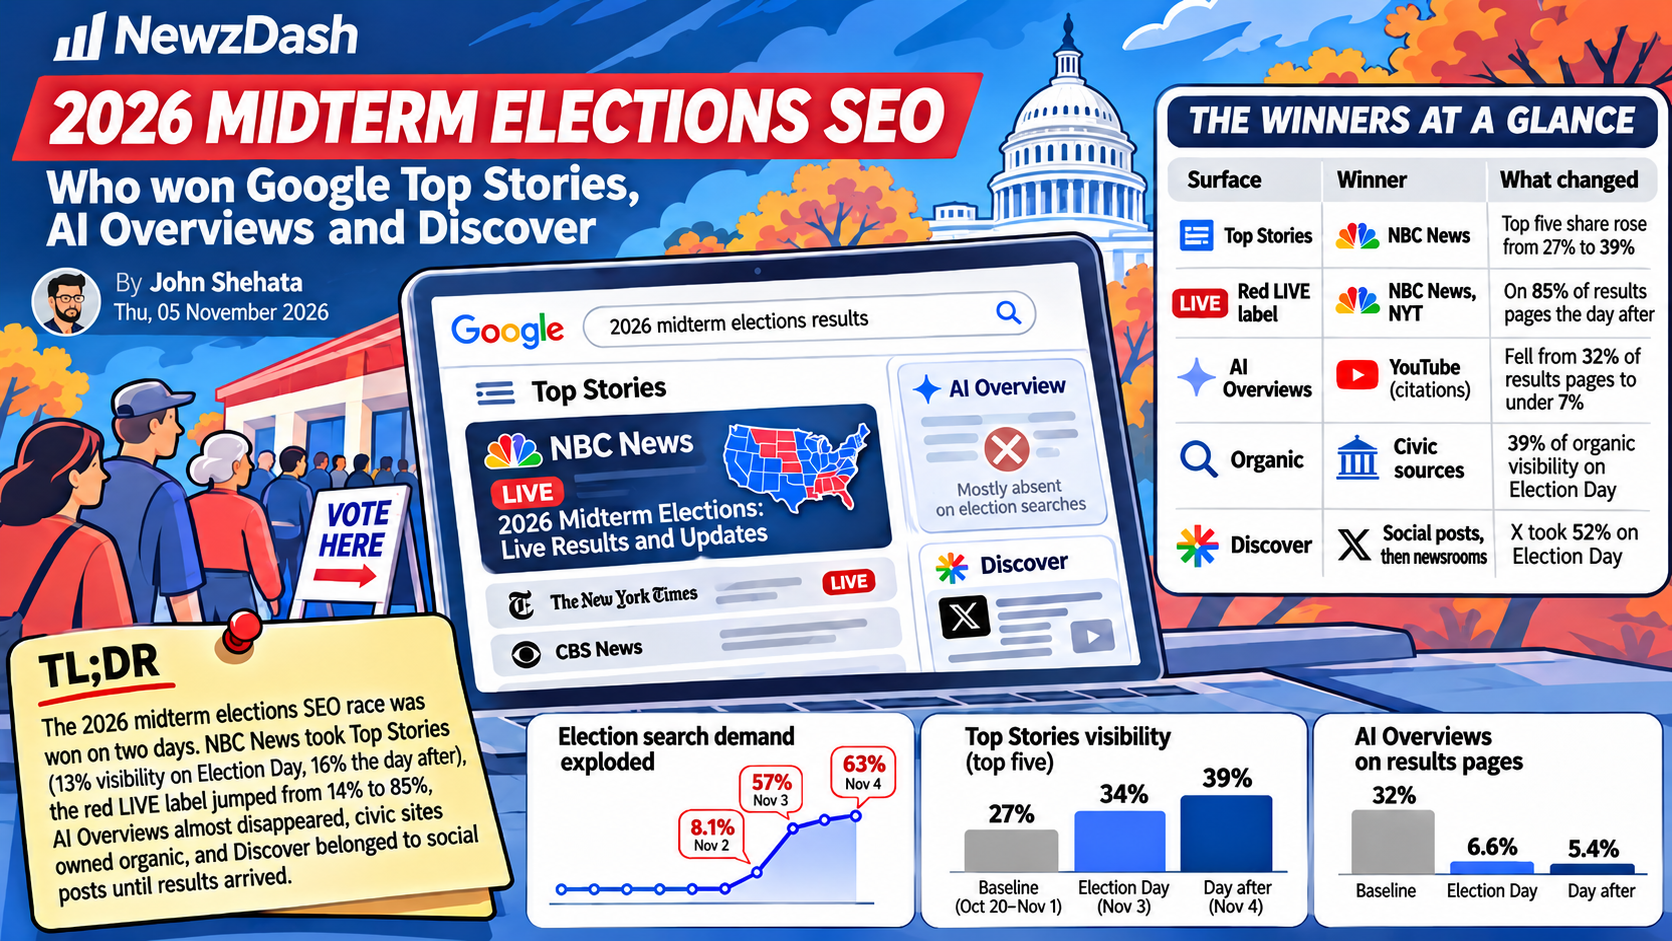
TL;DR: The 2026 midterm elections SEO race was won on two days. Election searches barely registered in US Google Trends until November 2, then took 57% of trending search volume on Election Day and 63% the day after. NBC News took Top Stories, holding 13% visibility on Election Day and 16% the day after, and led every hour of election night. The red LIVE label went from 14% of results pages to 85%. AI Overviews almost disappeared from trending election searches. Civic sites owned organic. Discover belonged to social posts until results arrived.
| Surface | Winner | What changed |
|---|---|---|
| Top Stories | NBC News | Top five share rose from 27% to 39% |
| Red LIVE label | NBC News, NYT | On 85% of results pages the day after |
| AI Overviews | YouTube (citations) | Fell from 32% of results pages to under 7% |
| Video | YouTube | YouTube's share of video rose from 57% to 74% |
| Organic | Civic sources | 39% of organic visibility on Election Day |
| Discover | Social posts, then newsrooms | X took 52% on Election Day |
How we measured the 2026 midterms
This analysis covers US Google results from October 20 to November 4, 2026, in US Eastern time. We tracked 1287 keywords with over 100,000+ Google Results from 4000+ domains.
We split the window into three periods: the two weeks before the vote (October 20 to November 2), Election Day (November 3) and the day after (November 4).
Every share in this article is visibility: a domain's ranking score divided by the total score of all domains in the same surface, period and keyword set. Frequencies are the share of Google checks where a feature appeared.
Election search demand arrived late, then exploded
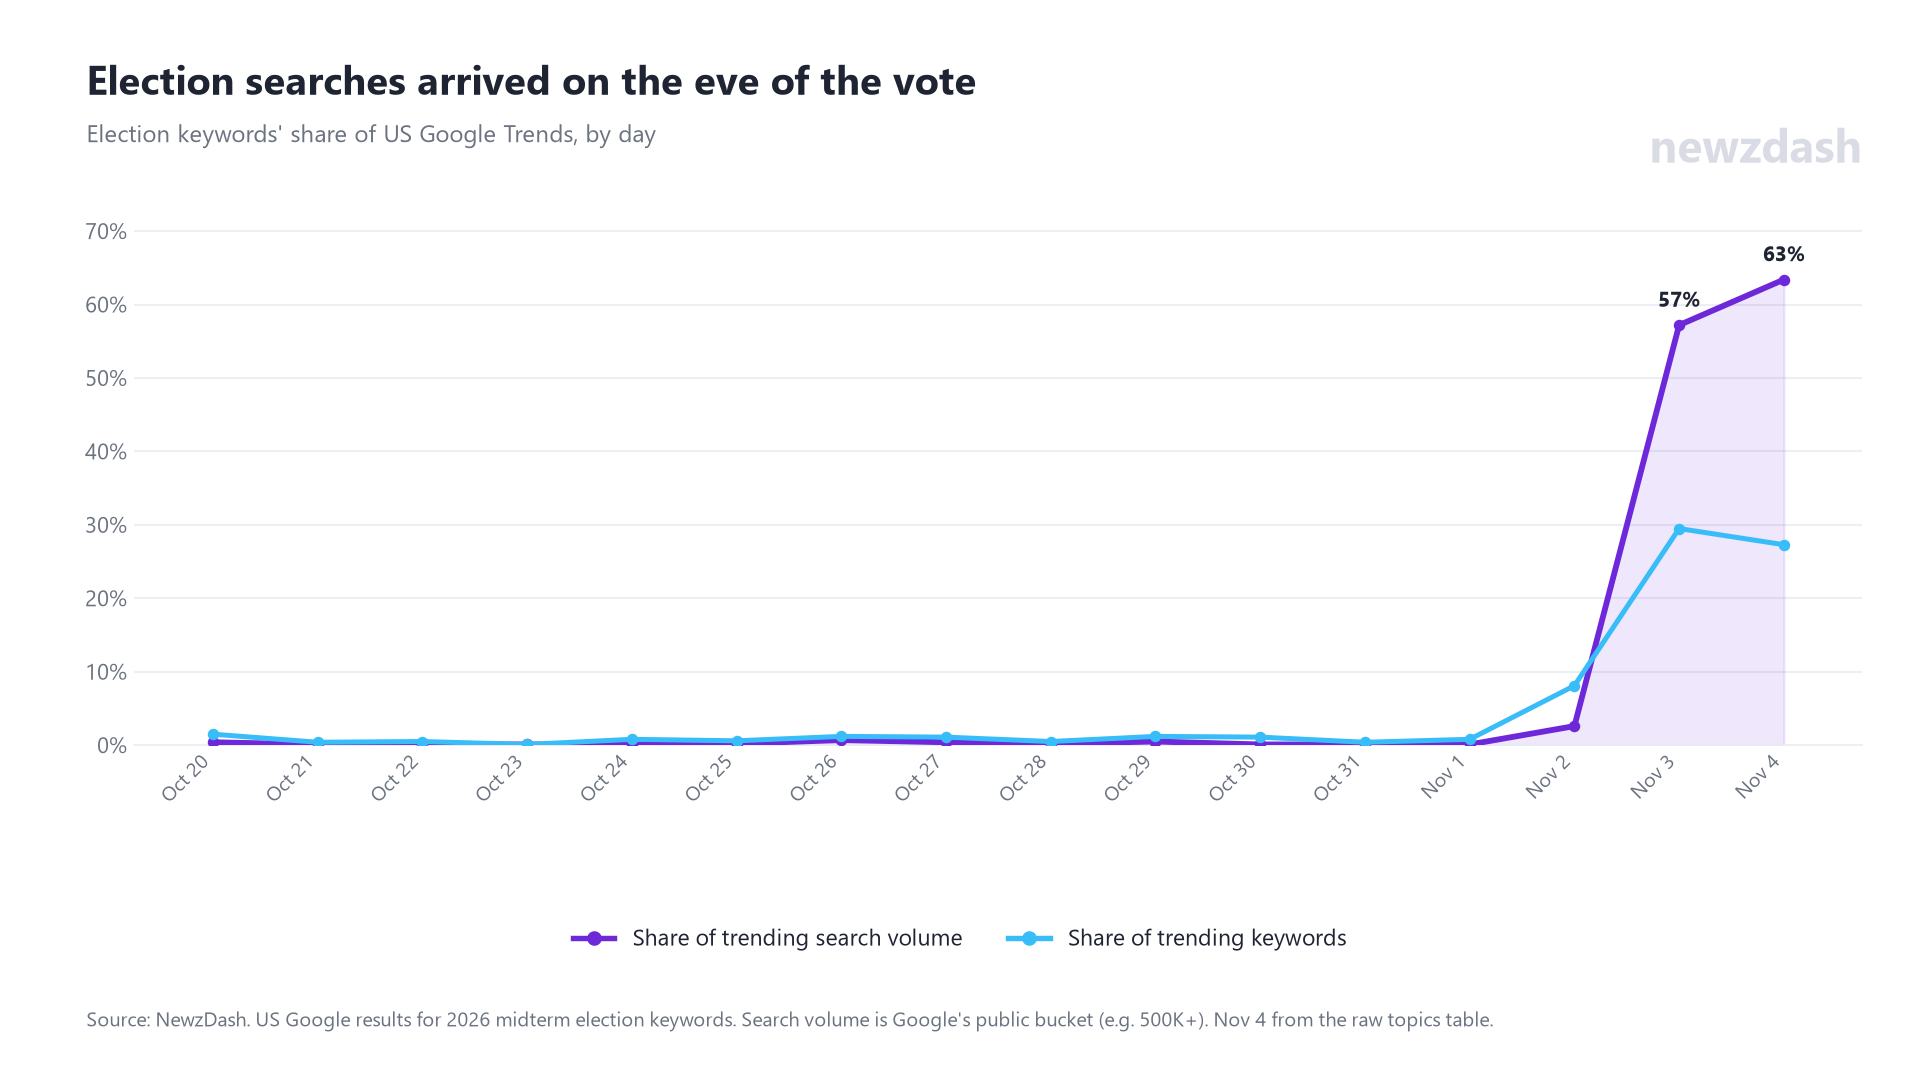
For two weeks, the midterms were a publisher story, not a searcher story. Between October 20 and November 1, election keywords made up 0.1% to 1.5% of US trending searches each day. On November 2 that jumped to 8.1%.
Each day asked a different question:
- Before the vote: "Election Day" (110,000+ searches), Mary Peltola, Jon Ossoff, the Texas and Alaska Senate races.
- November 2: how to vote. Thirty-one trends like "when is election day", "am i registered to vote" and "can i vote today".
- November 3: results. "2026 us election results" reached 5M+ searches. James Talarico was the only candidate name to reach 2M+.
- November 4: more results. "2026 us election results" hit 10M+, "2026 united states senate elections" 5M+, and results searches for ten states reached 2M+ each, from California and Florida to Maine and Washington state. How-to-vote searches dropped from 93 trends to 2.
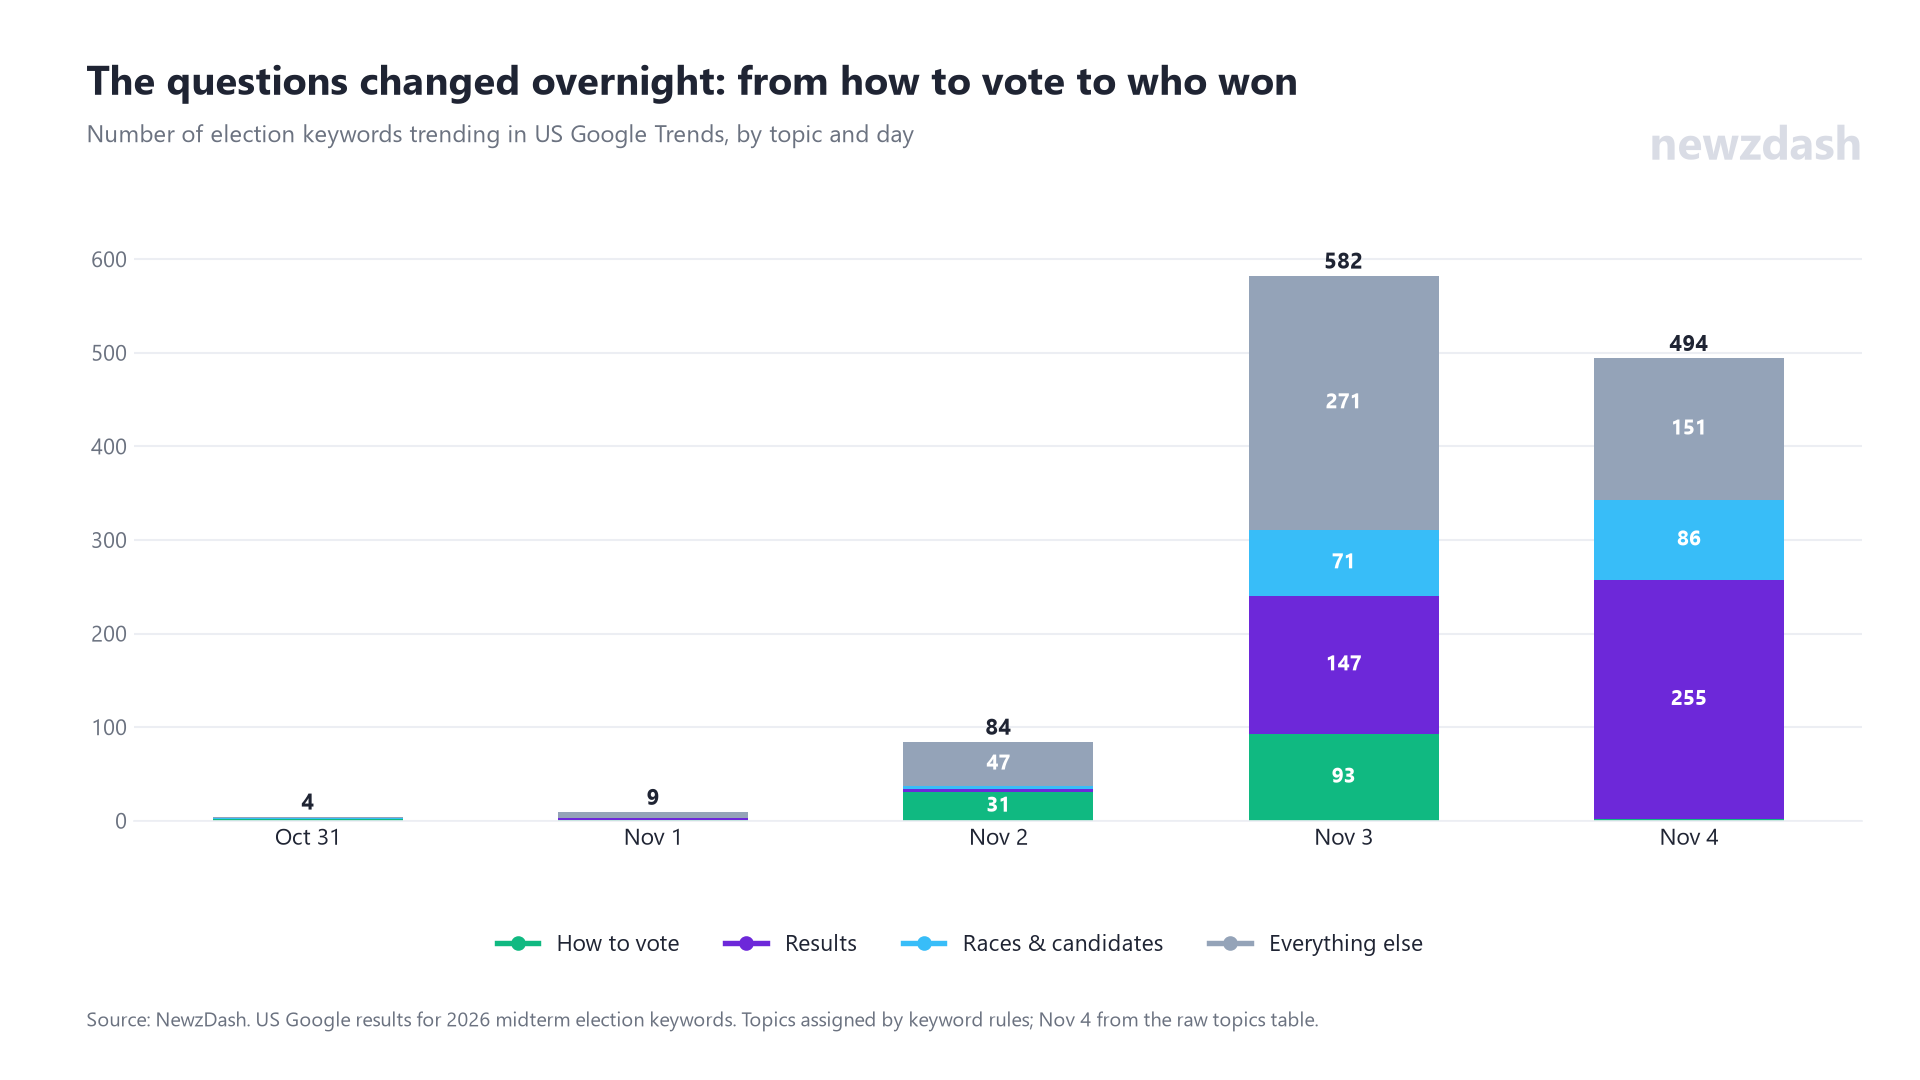
Election interest was intense and short. 73% of the 970 election keywords trended on a single day.
Election searches went from under 1% of US trending search volume to 63% the day after the vote.
What this means for publishers: your election traffic window is roughly 72 hours. The how-to-vote content has to rank by November 2. The results pages have to be indexed and ranking before polls close, because the biggest searches happen the morning after.
The two weeks before the vote: who led Top Stories
Before Election Day, Top Stories was a broad field. The New York Times led, but six publishers held more than 4% each.
| Rank | Domain | Top Stories visibility, Oct 20 to Nov 2 |
|---|---|---|
| 1 | New York Times | 7.5% |
| 2 | CNN | 5.7% |
| 3 | Guardian | 5.5% |
| 4 | Reuters | 4.2% |
| 5 | NBC News | 4.2% |
| 6 | Fox News | 4.1% |
| 7 | Yahoo | 3.0% |
| 8 | NPR | 2.8% |
| 9 | Washington Post | 2.7% |
| 10 | Politico | 2.6% |
The articles that ranked best tell you what the campaign phase rewarded: live coverage of the trail and big-picture framing.
| Rank | Article | Domain | Visibility |
|---|---|---|---|
| 1 | Midterm Elections Live Updates: Stevens Splits With El-Sayed to Endorse Republican in Michigan Senate Race | nytimes.com | 0.73% |
| 2 | Midterm Elections Updates: Trump to Rally in Florida, Where Polls Show Close Races | nytimes.com | 0.60% |
| 3 | Anything short of a blue wave could seem like a loss to Democrats | cnn.com | 0.57% |
| 4 | Why Wouldn't Google Tell Me Who Won the 2020 Election? | theatlantic.com | 0.52% |
| 5 | Live updates: Trump and Obama hit the trail for dueling rallies | cnn.com | 0.49% |
| 6 | Election 2026 live updates: Trump to give closing message on the midterms at the Lincoln Memorial | nbcnews.com | 0.48% |
| 7 | Would Trump accept GOP midterm losses? 7 in 10 Americans doubt it. | washingtonpost.com | 0.39% |
| 8 | US midterms 2026 live: Trump, Democrats make final push amid Michigan rift | aljazeera.com | 0.36% |
| 9 | 2026 Midterm Elections: Trump, Democrats Campaign | foxnews.com | 0.34% |
| 10 | Trump approval rises from record low to 32% ahead of midterm election, Reuters Ipsos poll finds | reuters.com | 0.34% |
Five of the top ten were live pages. No single article held more than 0.73%, a sign of how spread out visibility was before the vote. The Atlantic's story at number four ranked on a single trending search, "who won the 2020 presidential election", which shows how one trend can lift an article into the leaders.
Five of the ten best-ranking election articles before the vote were live pages.
NBC News won Top Stories, and the gap widened after the polls closed
Election Day reset the board.
| # | Before the vote (Oct 20 to Nov 2) | Election Day (Nov 3) | Day after (Nov 4) |
|---|---|---|---|
| 1 | NYT 7.5% | NBC News 13.0% | NBC News 16.0% |
| 2 | CNN 5.7% | NYT 9.1% | NYT 14.1% |
| 3 | Guardian 5.5% | CBS News 4.8% | Washington Post 4.3% |
| 4 | Reuters 4.2% | PBS 3.4% | Guardian 2.8% |
| 5 | NBC News 4.2% | Guardian 3.3% | AP 2.2% |
| 6 | Fox News 4.1% | BBC 2.6% | CBS News 2.2% |
| 7 | Yahoo 3.0% | Yahoo 2.3% | Fox News 2.1% |
| 8 | NPR 2.8% | CNN 2.3% | BBC 1.9% |
| 9 | Washington Post 2.7% | Washington Post 2.2% | NPR 1.9% |
| 10 | Politico 2.6% | CNBC 1.9% | CNN 1.4% |
| Top 5 share | 27.0% | 33.6% | 39.4% |
The top five took 34% on Election Day and 39% the day after. NBC News and the Times alone held 30% of Top Stories the morning after.
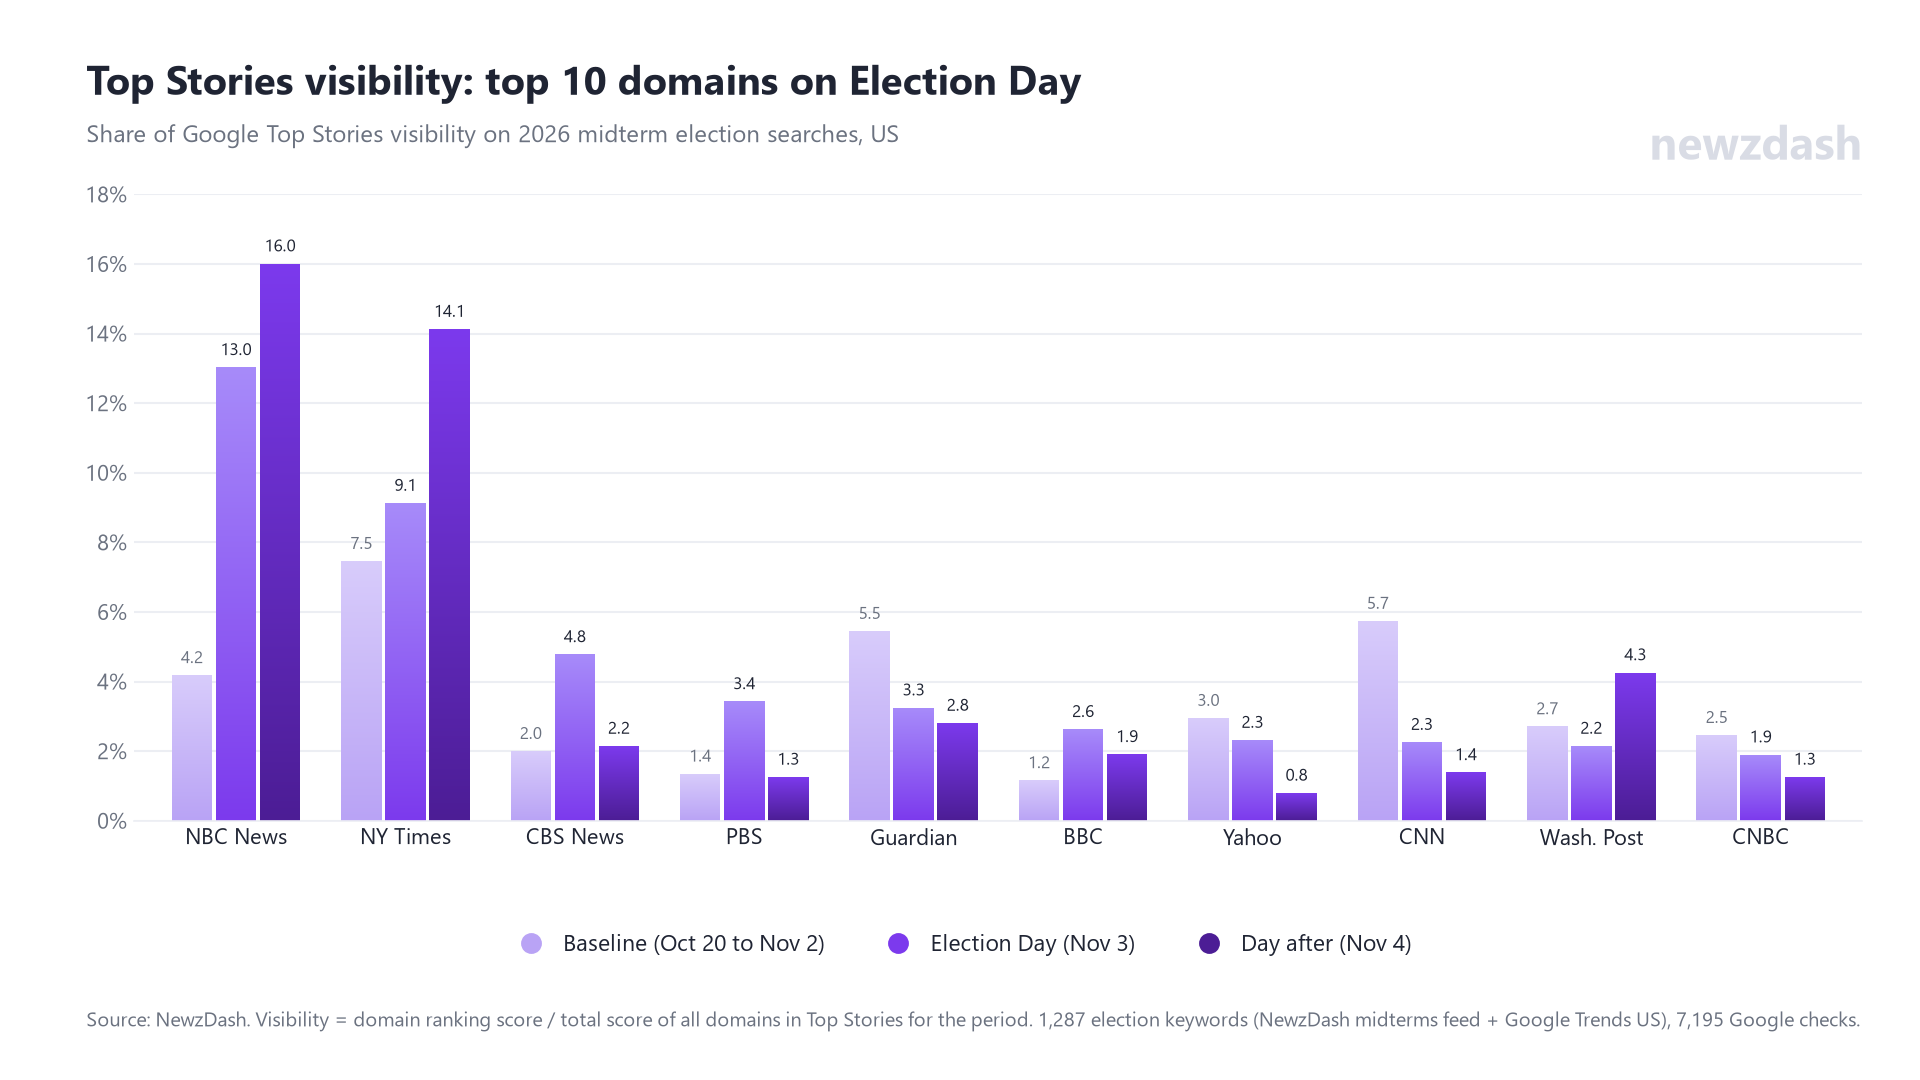
NBC News and The New York Times held 30% of all Top Stories visibility the morning after the election.
The other side of the board: CNN fell from 5.7% before the vote to 2.3% on Election Day. Reuters dropped 2.8 points, Fox News 2.4. The two keyword sets mix differently across periods, so we checked each one separately. The direction held in both: NBC News gained 4.8 points on headline keywords and 11.2 on trending searches, while CNN lost 2.8 and 6.2.
The top articles show where that visibility went:
| Period | Article | Domain | Visibility |
|---|---|---|---|
| Election Day | 2026 Midterm Elections Live Updates: Voters Head to the Polls to Decide Control of Congress | nytimes.com | 1.88% |
| Election Day | U.S. Senate Midterm Election Live Results 2026 | nbcnews.com | 1.57% |
| Election Day | Live updates: 2026 US midterm elections and results | bbc.com | 1.49% |
| Day after | Alaska U.S. Senate Election 2026 Live Results: Mary Peltola, Dan Sullivan and More | nbcnews.com | 1.48% |
| Day after | Mississippi U.S. Senate Midterm Election 2026: Live Results | nbcnews.com | 1.06% |
| Day after | Keisha Lance Bottoms Wins in Georgia to Become First Black Woman Elected U.S. Governor | nytimes.com | 0.89% |
On the 23 election keywords that peaked at 2M+ searches, NBC News held 22.7% visibility, ranked first on 15 of them and was top three on 22. The exceptions went to specialists. AP won "midterm elections results" (21%). Newsweek won "james talarico" (20%). Local outlets won their own races: St. Louis Public Radio led "missouri election results" (20%), and Orlando's WESH led "florida governor" (29%).
Election traffic does not spread across publishers. It concentrates at the moment it peaks.
Race by race: who won the biggest contests
National results are only half the story. We grouped every keyword naming a candidate or a race into the contests that drew the most searches, then ranked Top Stories visibility within each race over the full period.
| Race | First | Second | Third | Fourth |
|---|---|---|---|---|
| Texas Senate | NBC News 14.7% | PBS 9.6% | Newsweek 8.7% | NYT 7.0% |
| Alaska Senate | NBC News 20.1% | NYT 11.2% | Alaska Beacon 5.4% | The Hill 5.2% |
| Maine Senate | NBC News 15.0% | NPR 9.4% | NYT 8.7% | WMTW 5.9% |
| Michigan Senate | Politico 8.1% | Fox News 7.4% | CNN 7.3% | NYT 6.9% |
| Georgia governor | NYT 25.0% | NBC News 14.9% | FOX 5 Atlanta 6.4% | NPR 5.4% |
| Texas governor | AP 15.2% | NYT 14.3% | NBC News 8.8% | Houston Chronicle 5.9% |
| Ohio governor | NBC News 21.8% | NYT 9.9% | AP 8.1% | Columbus Dispatch 6.4% |
| Florida governor | WESH 28.9% | NBC News 18.0% | Washington Post 8.3% | Fox News 6.6% |
NBC News led four of the eight races, but not the ones that mattered most to two other newsrooms. The Times owned the Georgia governor's race at 25%, the highest single-race share of any national publisher. AP won the Texas governor's race, where Gina Hinojosa's win made national news. Michigan was the most open contest: no publisher passed 8.1%.
Local outlets made the top four in six of the eight races, from the Alaska Beacon and Maine's WMTW to FOX 5 Atlanta, the Houston Chronicle and the Columbus Dispatch. In Florida, Orlando's WESH beat every national brand.
Implication: in state races, local newsrooms compete with national brands for the same Top Stories slots, and the strongest ones win. Michigan and Florida governor rest on 34 and 15 checks, so treat those two as directional.
Coverage gaps: how much of the election each publisher showed up for
Visibility measures how well you rank. Coverage measures whether you ranked at all. For each publisher, we counted the share of election keywords where it appeared in Top Stories at least once.
| Publisher | Before the vote (631 keywords) |
Election Day (272) | Day after (230) |
|---|---|---|---|
| NBC News | 32% | 58% | 68% |
| New York Times | 40% | 56% | 66% |
| Washington Post | 21% | 33% | 45% |
| CBS News | 22% | 40% | 38% |
| Guardian | 30% | 29% | 39% |
| PBS | 21% | 36% | 36% |
| AP | 18% | 25% | 33% |
| CNN | 29% | 25% | 25% |
| Fox News | 24% | 20% | 30% |
| Reuters | 30% | 19% | 28% |
| BBC | 13% | 25% | 26% |
| NPR | 21% | 14% | 26% |
Two things stand out. Before the vote, the Times appeared on more election keywords than NBC News (40% against 32%), with the Guardian and Reuters close behind at 30% each. NBC's lead came on Election Day, when its coverage nearly doubled to 58% and kept rising to 68% the day after.
CNN went the other way. It appeared on 29% of election keywords before the vote and 25% on Election Day and the day after. That coverage gap explains much of its visibility drop: CNN was simply absent from three of every four election searches when demand peaked.
CNN was missing from 3 of every 4 election searches on Election Day.
Recommendation: measure coverage, not just rank. A publisher missing from 75% of peak election searches cannot win them, no matter how well its live page ranks where it does appear.
Before the polls opened: the overnight and morning hours
Election Day started long before the first results. We tracked Top Stories hour by hour from midnight to noon Eastern on November 3.
| Hour (ET) | Leader | International outlets' share |
|---|---|---|
| Midnight | NYT 13.7% | 11.6% |
| 1 a.m. | NYT 12.8% | 18.0% |
| 2 a.m. | NYT 15.2% | 18.3% |
| 3 a.m. | NYT 12.0% | 20.5% |
| 4 a.m. | USA Today 14.1% | 8.2% |
| 5 a.m. | USA Today 15.0% | 11.9% |
| 6 a.m. | CBS News 22.2% | 8.2% |
| 7 a.m. | CBS News 6.6% | 18.0% |
| 8 a.m. | CBS News 8.7% | 16.0% |
| 9 a.m. | CBS News 8.8% | 18.1% |
| 10 a.m. | NBC News 9.0% | 17.3% |
| 11 a.m. | CBS News 10.3% | 9.8% |
| Noon | NYT 7.3% | 9.1% |
International outlets here are the Guardian, BBC, Al Jazeera, Reuters and other non-US publishers. Their share peaked at 20.5% at 3 a.m., but none of them led a single hour. The Times held the overnight hours, USA Today the early morning and CBS News the morning as voters headed to the polls. NBC News did not lead until 10 a.m. From 1 p.m. on, it led every hour but one: at 3 p.m. the Times edged it by a hundredth of a point.
Across the whole period, the international share shrank as the election came closer: 14.8% of Top Stories visibility before the vote, 9.4% on Election Day and 6.6% the day after. The overnight hours rest on 9 to 14 checks each, so read them as directional.
Election night was a live coverage race
We split election night, 6 p.m. November 3 to 4 a.m. November 4 Eastern, into 11 hourly windows. NBC News led all 11.
| Hour (ET) | NBC News | New York Times | Third place | LIVE share of results | New URLs vs prior hour |
|---|---|---|---|---|---|
| 6 p.m. | 12.5% | 8.7% | CBS News 5.3% | 23.0% | n/a |
| 7 p.m. | 17.4% | 10.6% | CNN 4.1% | 29.7% | 54% |
| 8 p.m. | 17.2% | 12.1% | CBS News 4.0% | 35.2% | 65% |
| 9 p.m. | 20.8% | 12.4% | Washington Post 5.9% | 35.7% | 46% |
| 10 p.m. | 20.8% | 12.1% | Washington Post 4.4% | 30.5% | 57% |
| 11 p.m. | 20.8% | 13.0% | CNN 3.9% | 32.0% | 62% |
| Midnight | 21.2% | 13.7% | Washington Post 3.6% | 28.4% | 55% |
| 1 a.m. | 17.6% | 14.1% | Washington Post 4.4% | 23.6% | 48% |
| 2 a.m. | 16.8% | 14.7% | Washington Post 4.3% | 27.3% | 50% |
| 3 a.m. | 17.3% | 13.6% | Washington Post 4.6% | 23.7% | 42% |
| 4 a.m. | 20.1% | 15.7% | Washington Post 4.2% | 24.2% | 32% |
For the whole night, NBC News held 18.4%, the Times 12.9% and the Washington Post 3.9%.
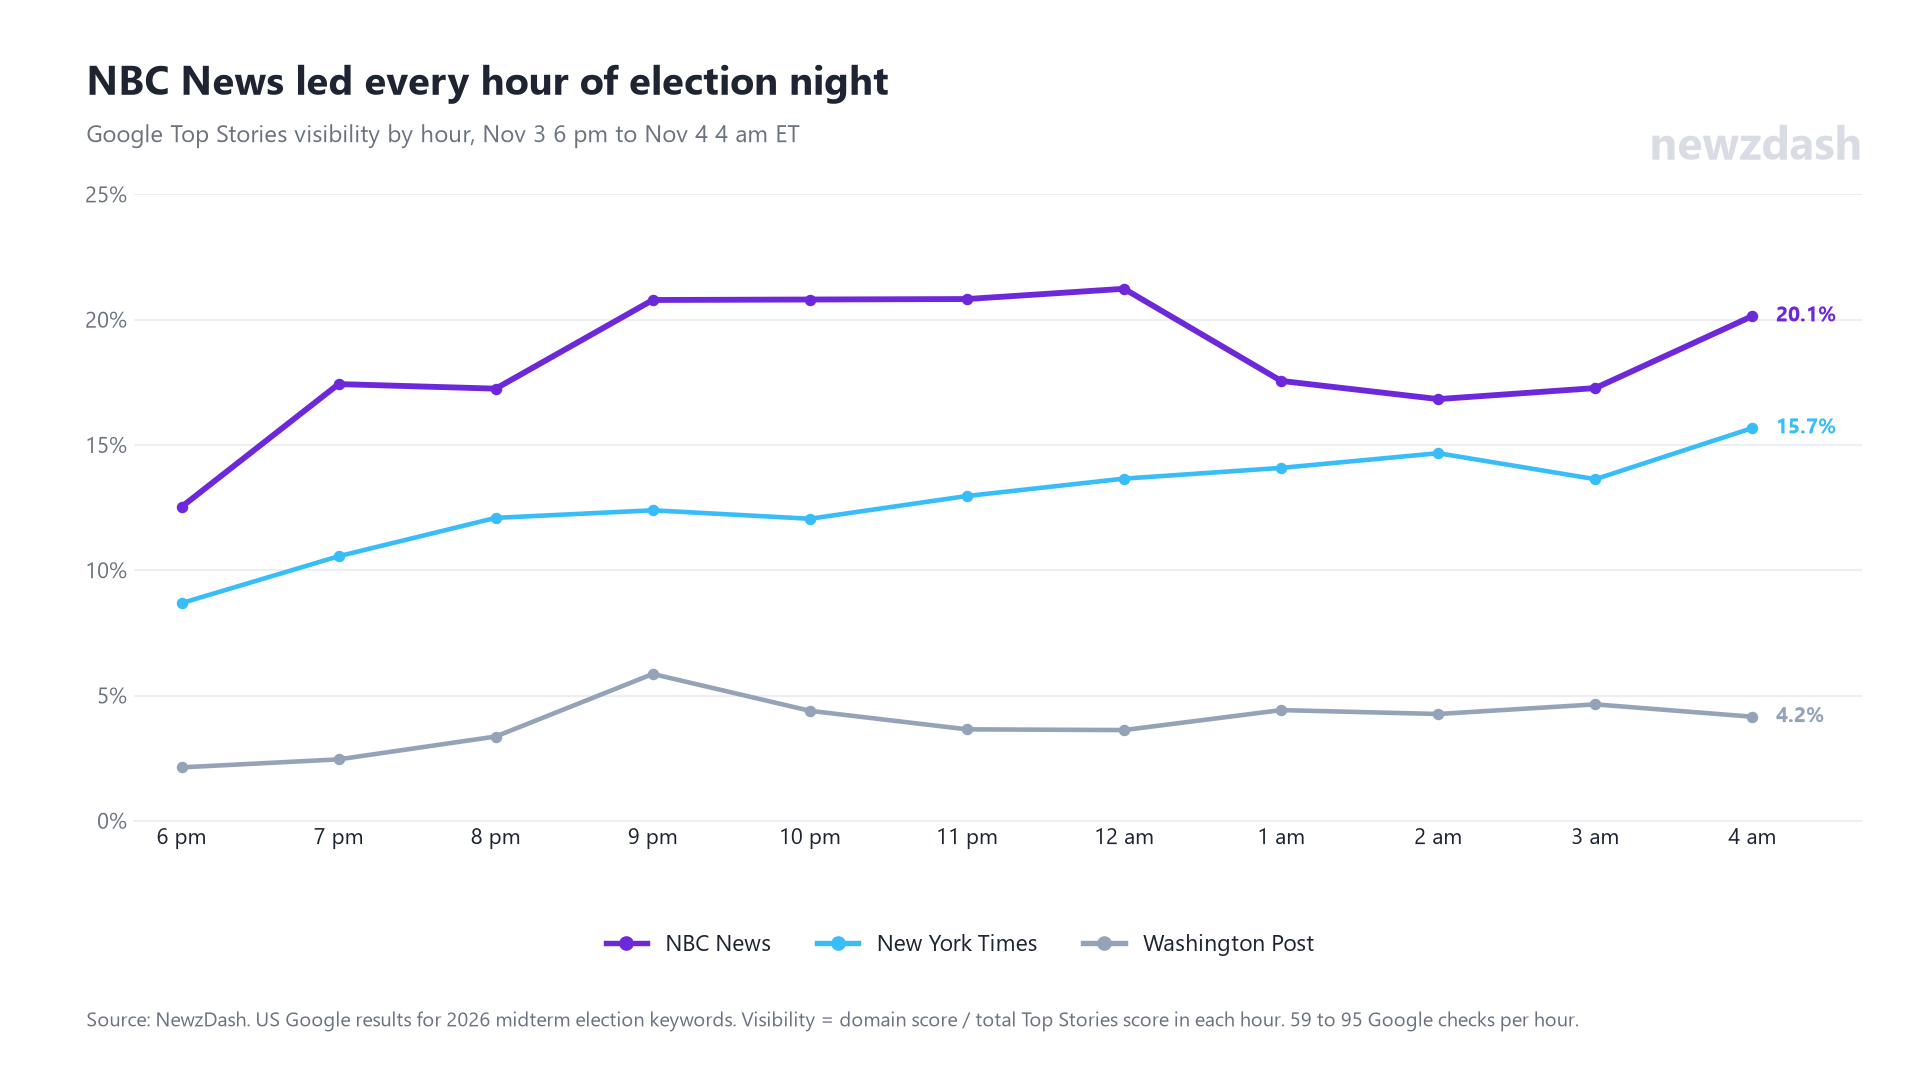
NBC News led Google Top Stories in all 11 hours of election night.
The red LIVE label decided much of that. It appeared on 14% of results pages before the vote, 63% on Election Day and 85% the day after. Before the vote, LIVE visibility was spread among the Times (20.5%), CNN (19.3%) and NBC News (15.8%). The day after, NBC News, the Times and the Post held 82% of it.
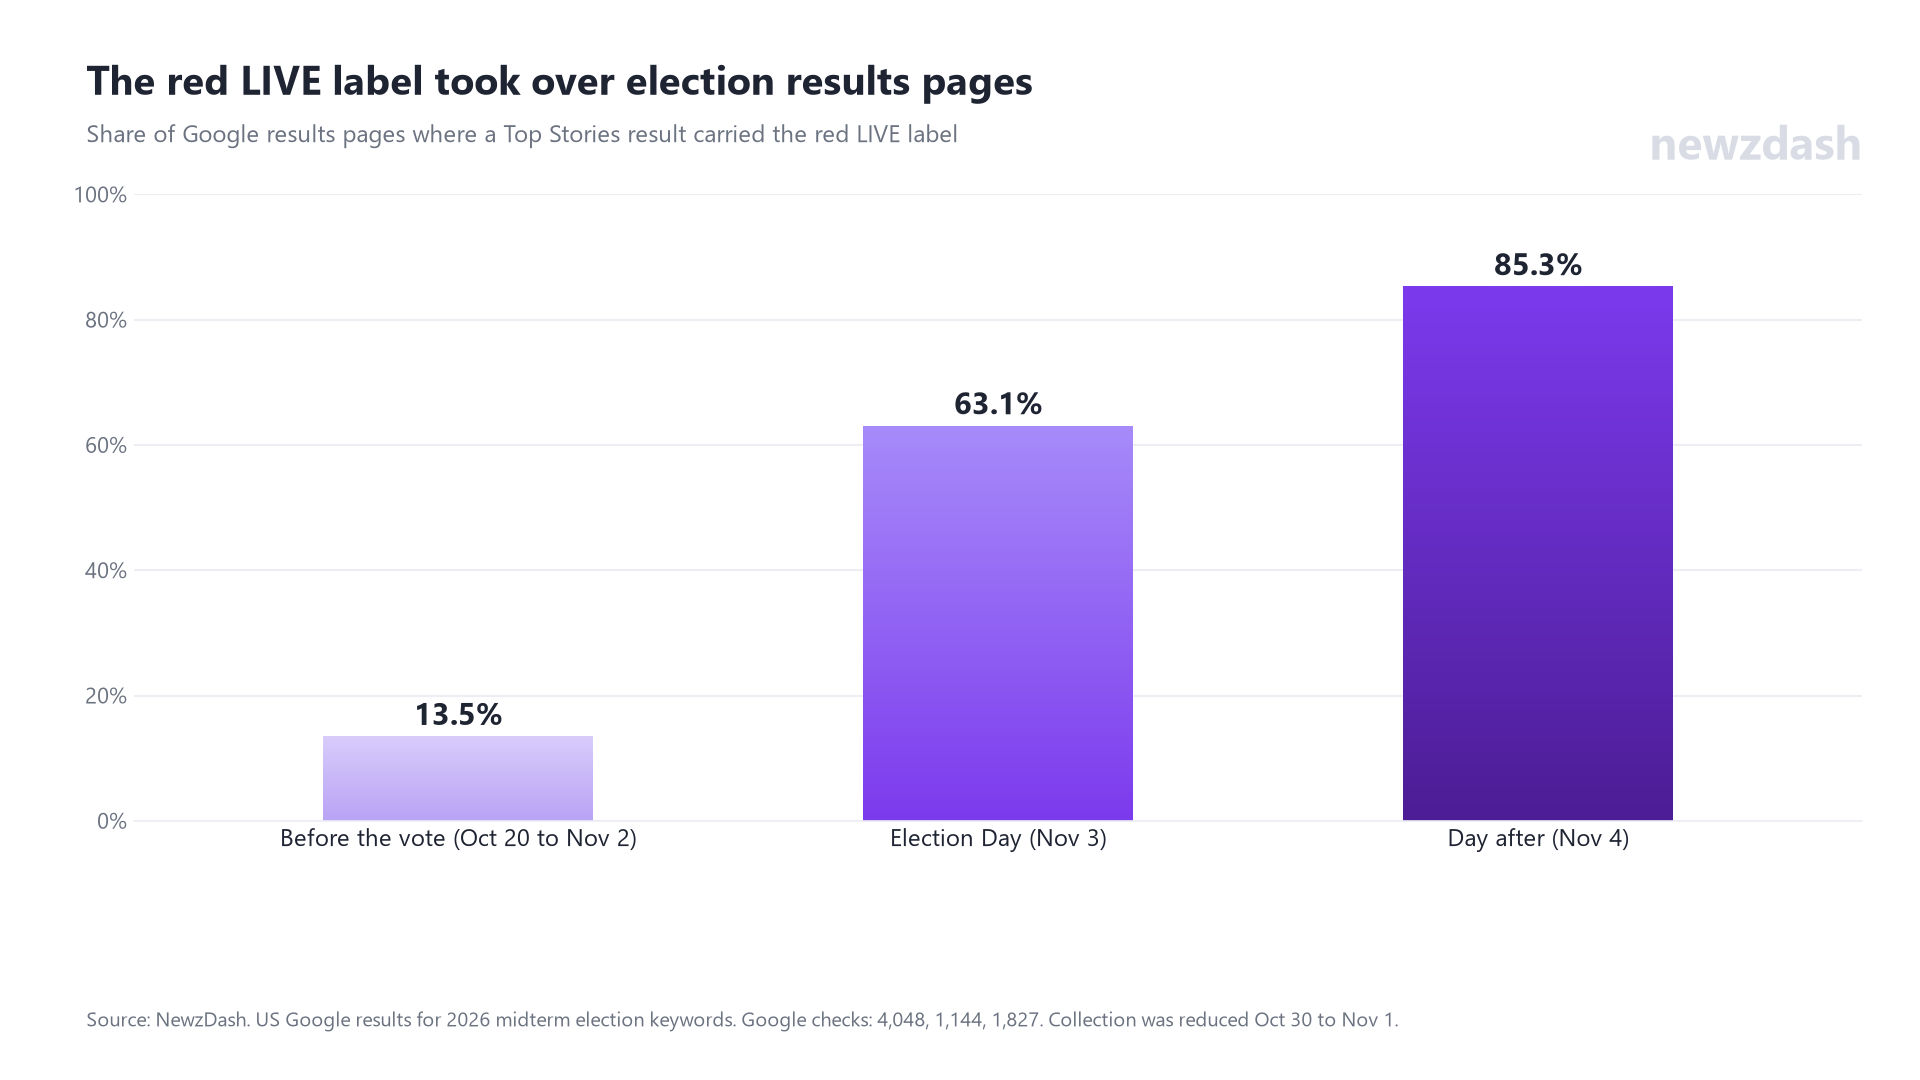
The red LIVE label appeared on 85% of election results pages the day after the vote.
The format data points the same way. Live blogs and live results pages were 9% of Top Stories results before the vote and 37% on Election Day. On Election Day they averaged position 6.9, against 8.3 for standard articles. Freshness took over the top of the carousel: 94% of positions 1 to 3 were under 24 hours old on Election Day, up from 77% before the vote.
Top Stories also churned fast. More than half of the URLs seen on election night appeared in only one hour. Only 13 lasted all night.
Implication: one live URL that stays fresh beats a string of short articles that each rank for an hour.
Recommendation: run a single persistent live page per race cluster, validate its live markup before polls close, and keep updates flowing through the night. Our World Cup 2026 SEO playbook covers the live blog setup we recommend for high-velocity events.
AI Overviews mostly stepped aside on election searches
We measured three things on every Google check: whether the page had an AI Overview with cited links, whether it had Top Stories, and whether Top Stories appeared inside the AI Overview.
| Period | Keyword set |
AI Overview present |
Top Stories inside AI Overview (share of AI Overviews) |
|---|---|---|---|
| Before the vote | Both | 32.3% | 18.7% |
| Before the vote | Headline keywords | 34.3% | 18.3% |
| Before the vote | Trending searches | 10.3% | 35.3% |
| Election Day | Both | 6.6% | 28.9% |
| Election Day | Headline keywords | 26.2% | 33.3% |
| Election Day | Trending searches | 1.1% | 0% |
| Day after | Both | 5.4% | 21.2% |
| Day after | Headline keywords | 19.2% | 31.2% |
| Day after | Trending searches | 3.2% | 11.8% |
On the searches people were actually trending, AI Overviews appeared on 10 of 892 checks on Election Day, and none of those contained Top Stories. Meanwhile, Top Stories appeared on 91% of checks on Election Day and 98% the day after.
AI Overviews appeared on just 10 of 892 trending election searches on Election Day.
Who did AI Overviews cite? Platforms and reference sites first, newsrooms later.
| Rank | Before the vote | Election Day | Day after |
|---|---|---|---|
| 1 | YouTube 11.5% | YouTube 21.2% | YouTube 7.4% |
| 2 | Wikipedia 5.0% | Wikipedia 6.3% | Wall Street Journal 5.3% |
| 3 | Facebook 4.5% | Facebook 3.9% | New York Times 5.2% |
| 4 | Google 4.4% | Politico 2.8% | CNBC 4.8% |
| 5 | New York Times 2.6% | NBC News 2.5% | Wikipedia 4.6% |
When Top Stories appeared inside an AI Overview, the publisher mix was different again. Before the vote it was led by the Times (10.4%), the Guardian (6.2%) and CNN (5.7%). On Election Day, AP (10.8%), Politico (8.8%) and Axios (8.2%) led. The day after, NBC News (12.2%) and the Washington Post (8.2%) led.
Important nuance: Google said on September 9 that it would bring election information tools into AI Overviews, AI Mode and the Gemini app, including polling locations and AP results. We measured AI Overviews with cited links. We cannot tell from this data whether those tools appeared in another format. What we can say with confidence is that on the biggest election searches, Google sent attention to Top Stories, not to AI-generated summaries.
What this means for publishers: for hard news at peak moments, Top Stories is still the battlefield. AI Overview optimization belongs in the weeks before the vote, on explainer and issue queries, where they appeared on about a third of results pages.
SERP feature frequency: how election searches reshaped the results page
We measured SERP features in the same format as NewzDash's Google search features frequency tracker for US news queries: the share of Google results pages showing each feature. Here it covers the 7,019 election checks with complete results.
| Feature | Before the vote | Election Day | Day after |
|---|---|---|---|
| Top Stories | 70.7% | 90.8% | 98.4% |
| Red LIVE label | 13.5% | 63.1% | 85.3% |
| People Also Search For | 30.8% | 5.1% | 4.1% |
| Video | 71.2% | 70.3% | 93.0% |
| AI Overview | 32.3% | 6.6% | 5.4% |
| Top Stories inside AI Overview | 6.1% | 1.9% | 1.1% |
| What People Are Saying | 12.4% | 1.1% | 1.4% |
| Short Videos (reels) | 2.5% | 2.5% | 0.1% |
| Publisher Carousel | 0.0% | 0.0% | 0.0% |
Election searches rebuilt the results page around news. Top Stories went from 71% of results pages to 98%. The red LIVE label went from 13.5% to 85%. Everything that competes with news for space shrank: People Also Search For fell from 30.8% to 4.1%, What People Are Saying from 12.4% to 1.4%, and AI Overviews from 32.3% to 5.4%. Video held steady at about 70%, then jumped to 93% the day after. The publisher carousel did not appear once.
The shift started on the eve of the vote. On November 2, the LIVE label was already on 34% of results pages and People Also Search For had dropped to 16%.
People Also Search For dropped from 31% of election results pages to 4% once the votes were counted.
Winners by SERP feature
Each Google feature had its own winners. This table shows how often each feature appeared and who led it.
| Feature | Appeared on (before / Election Day / day after) |
Leaders before the vote |
Leaders on Election Day |
Leaders the day after |
|---|---|---|---|---|
| Top Stories | 71% / 91% / 98% | NYT 7.5%, CNN 5.7%, Guardian 5.5% | NBC News 13.0%, NYT 9.1%, CBS News 4.8% | NBC News 16.0%, NYT 14.1%, Washington Post 4.3% |
| Red LIVE label | 14% / 63% / 85% | NYT 20.5%, CNN 19.3%, NBC News 15.8% | NBC News 36.0%, NYT 22.2%, Washington Post 5.4% | NBC News 39.3%, NYT 33.5%, Washington Post 9.7% |
| AI Overview citations | 32% / 7% / 5% | YouTube 11.5%, Wikipedia 5.0%, Facebook 4.5% | YouTube 21.2%, Wikipedia 6.3%, Facebook 3.9% | YouTube 7.4%, WSJ 5.3%, NYT 5.2% |
| Video | 71% / 70% / 93% | YouTube 56.5%, Google 15.6%, Facebook 15.6% | YouTube 65.9%, Facebook 21.7%, PBS 4.7% | YouTube 74.0%, Facebook 12.5%, BBC 3.2% |
| Short Videos (reels) | 2.5% / 2.5% / 0.1% | YouTube 32.1%, Facebook 26.3%, Google 25.9% | YouTube 49.3%, Facebook 42.9%, Instagram 4.4% | YouTube 46.6%, TikTok 16.1%, Instagram 14.1% |
| What people are saying | 12.4% / 1.1% / 1.4% | Facebook 33.3%, Google 23.1%, YouTube 15.8% | Facebook 21.9%, X 20.9%, YouTube 16.7% | Facebook 53.7%, YouTube 14.9%, X 9.1% |
| Organic | every check | Wikipedia 11.0%, NBC News 4.9%, Facebook 4.0% | NBC News 9.7%, vote.org 6.7%, Wikipedia 5.5% | NBC News 13.8%, Wikipedia 7.5%, multistate.us 7.4% |
NBC News led three features at once on Election Day and the day after: Top Stories, the LIVE label and organic. No other newsroom led a single feature on those days; the rest went to YouTube and Facebook. Short Videos results on Election Day and the day after rest on 29 and 2 results pages, so treat their leaders as directional.
Video winners by domain and YouTube channel
Video was one of the most stable features of the election, on 70% or more of checks in every period. YouTube owned it, and its share grew as the vote approached.
| Rank | Before the vote | Election Day | Day after |
|---|---|---|---|
| 1 | youtube.com 56.5% | youtube.com 65.9% | youtube.com 74.0% |
| 2 | google.com 15.6% | facebook.com 21.7% | facebook.com 12.5% |
| 3 | facebook.com 15.6% | pbs.org 4.7% | bbc.com 3.2% |
| 4 | pbs.org 3.1% | bbc.com 0.9% | pbs.org 2.5% |
| 5 | bbc.com 1.3% | nbcnews.com 0.8% | nbcnews.com 0.9% |
Inside YouTube, the channel race looked very different from Top Stories. Shares are of YouTube's video visibility in each period.
| Rank | Before the vote | Election Day | Day after |
|---|---|---|---|
| 1 | CNN-News18 14.9% | CBS News 7.6% | NBC News 6.9% |
| 2 | CNN 6.2% | CNN-News18 6.6% | CBS News 6.8% |
| 3 | CBS News 5.0% | Associated Press 4.2% | CNN 5.0% |
| 4 | NBC News 4.2% | CNN 3.9% | MS NOW 3.6% |
| 5 | MS NOW 3.7% | Face the Nation 3.3% | FOX6 News Milwaukee 3.4% |
CNN-News18, an Indian news channel, led US election video before the vote. CBS News won Election Day, with its Face the Nation channel also in the top five. NBC News took the day after. PBS and the BBC were the only publisher websites with measurable video visibility outside YouTube and Facebook.
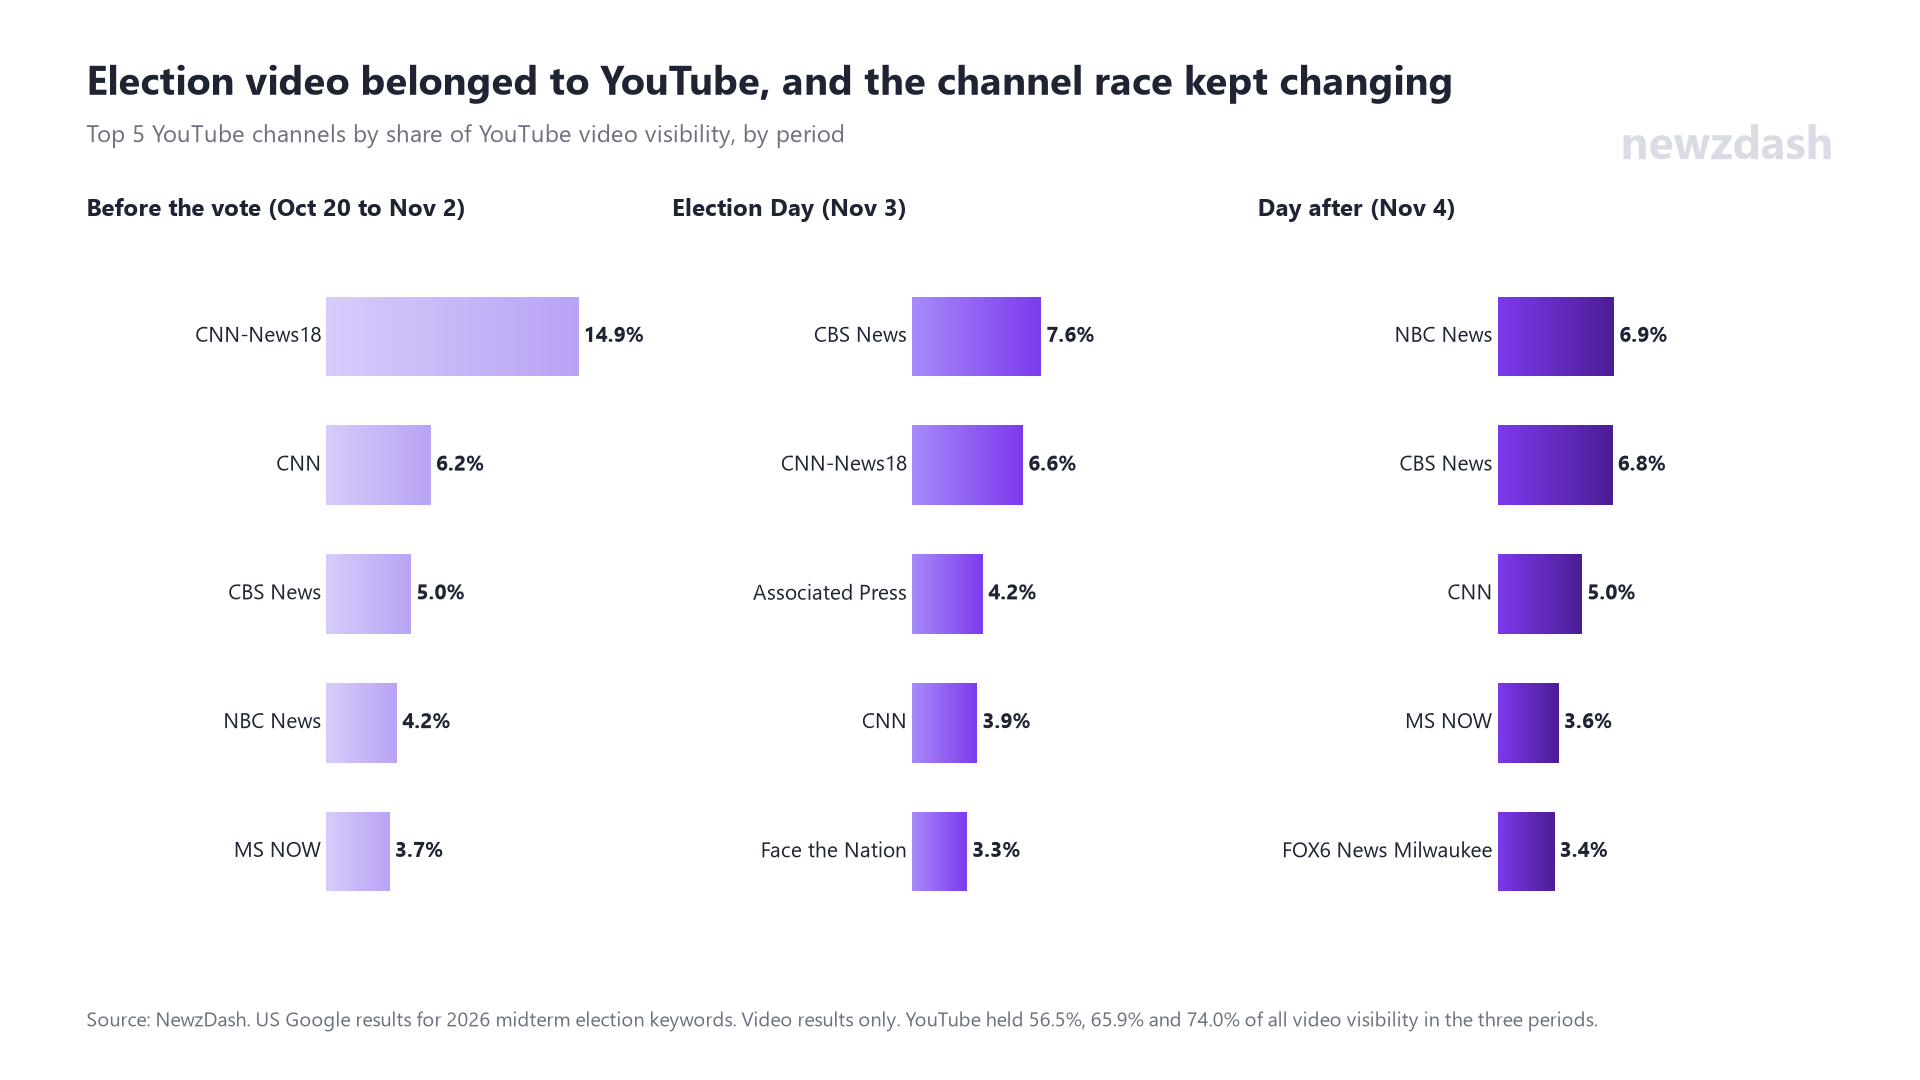
YouTube held 74% of election video visibility in Google the day after the vote.
Recommendation: treat YouTube as the video surface for elections. A newsroom's own video pages barely registered; its YouTube channel is what Google showed.
Organic results belonged to civic sources
On Election Day, civic sources took 39% of organic visibility, up from 29% before the vote. Government sites alone held 19.5%. Vote.org ranked second, at 6.7%. Wikipedia led organic across the window at 9.1% and never appeared in Top Stories.
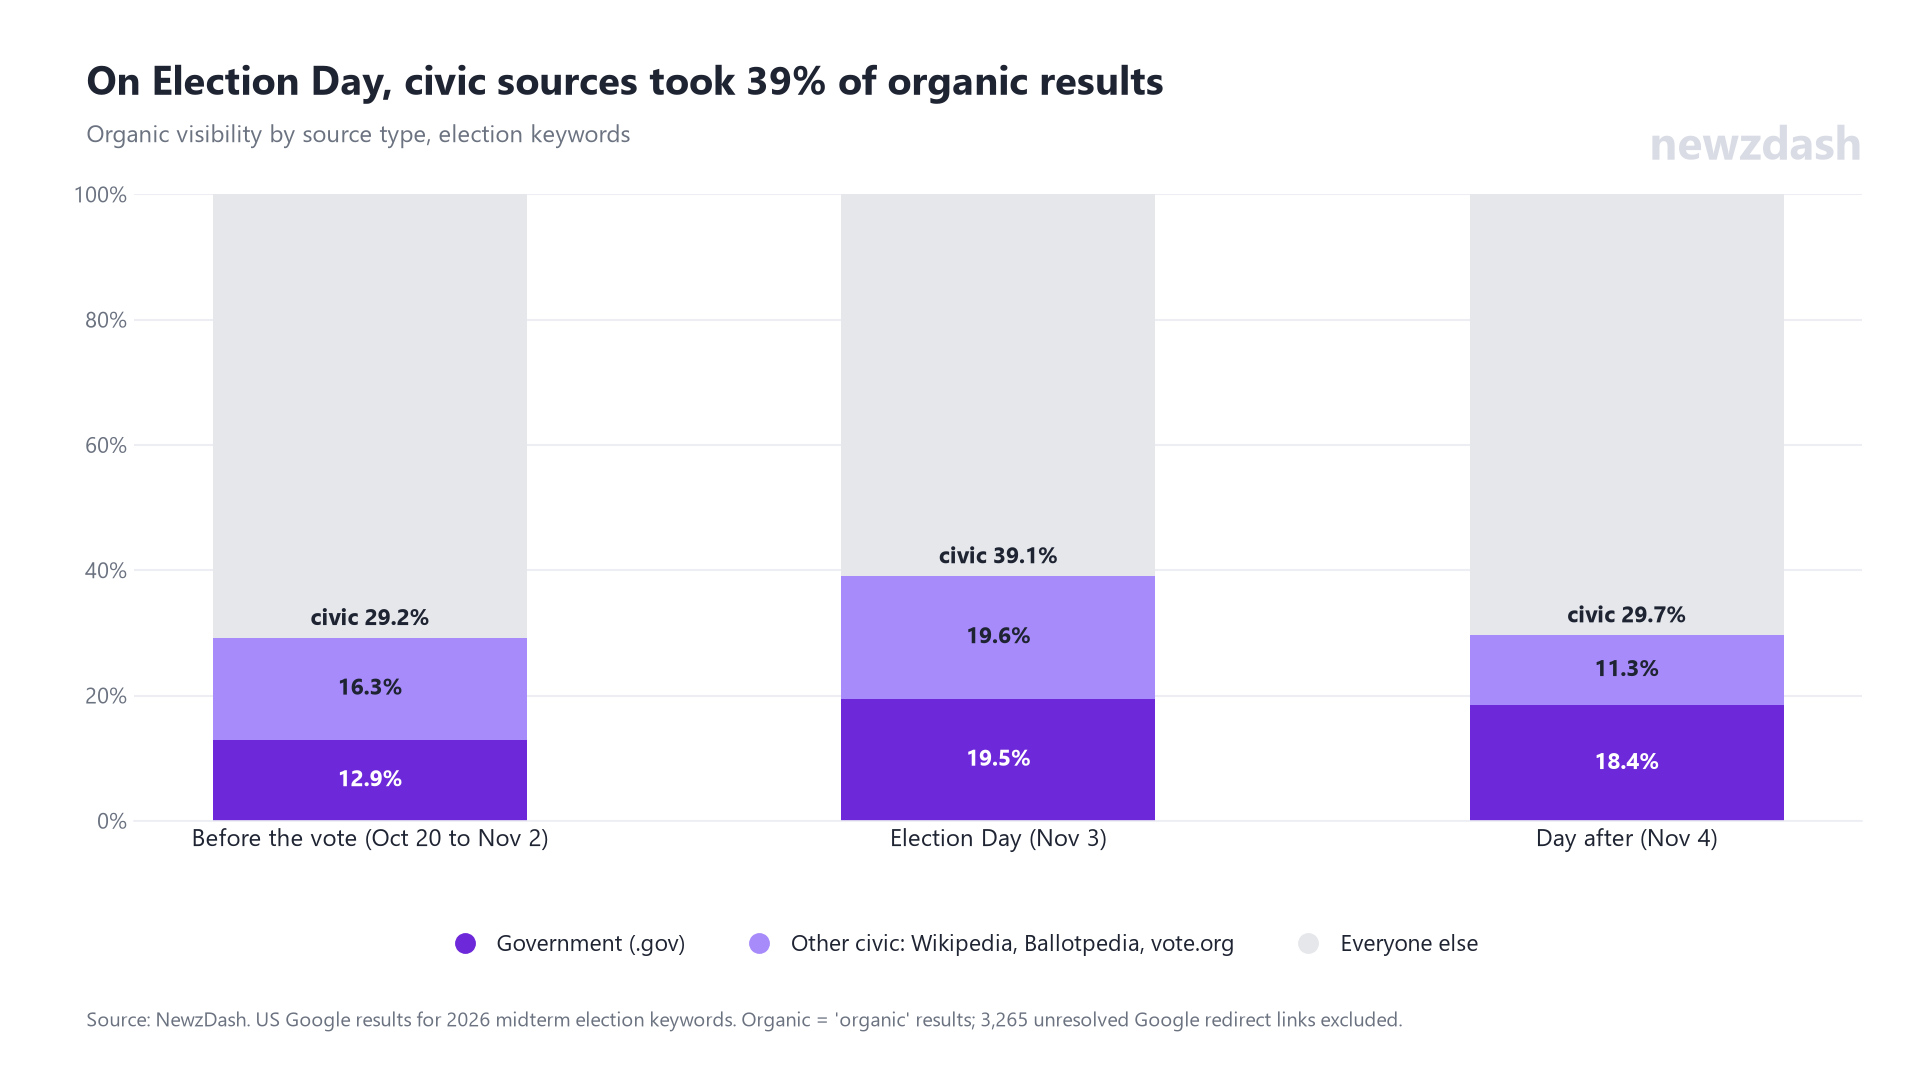
Government websites held 19.5% of organic visibility on Election Day.
NBC News was the only newsroom with real organic strength: first in organic on Election Day (9.7%) and the day after (13.8%).
For everyone else, the gap between surfaces was wide:
| Domain | Top Stories rank | Organic rank |
|---|---|---|
| Fox News | 6 | 32 |
| Washington Post | 5 | 19 |
| Guardian | 3 | 14 |
| NBC News | 2 | 2 |
Top Stories rewards speed and freshness. Organic rewarded reference pages that answer the same question for weeks. The longest-lived URLs in Top Stories make the point: NBC News's early-vote hub held on for 14 days, its midterms hub 11 days and a Reuters explainer 10 days. Meanwhile, 86% of the 13,686 Top Stories URLs appeared on a single day.
Recommendation: build evergreen election hubs, like a results page, a races page and a how-to-vote page, and update them in place. They are what carries a newsroom into organic results.
Google Discover was a social story until results arrived
The election took 37.8% of political Discover visibility over the period, rising to 84% for items first seen November 2. Social posts held 56% of election visibility in Discover.
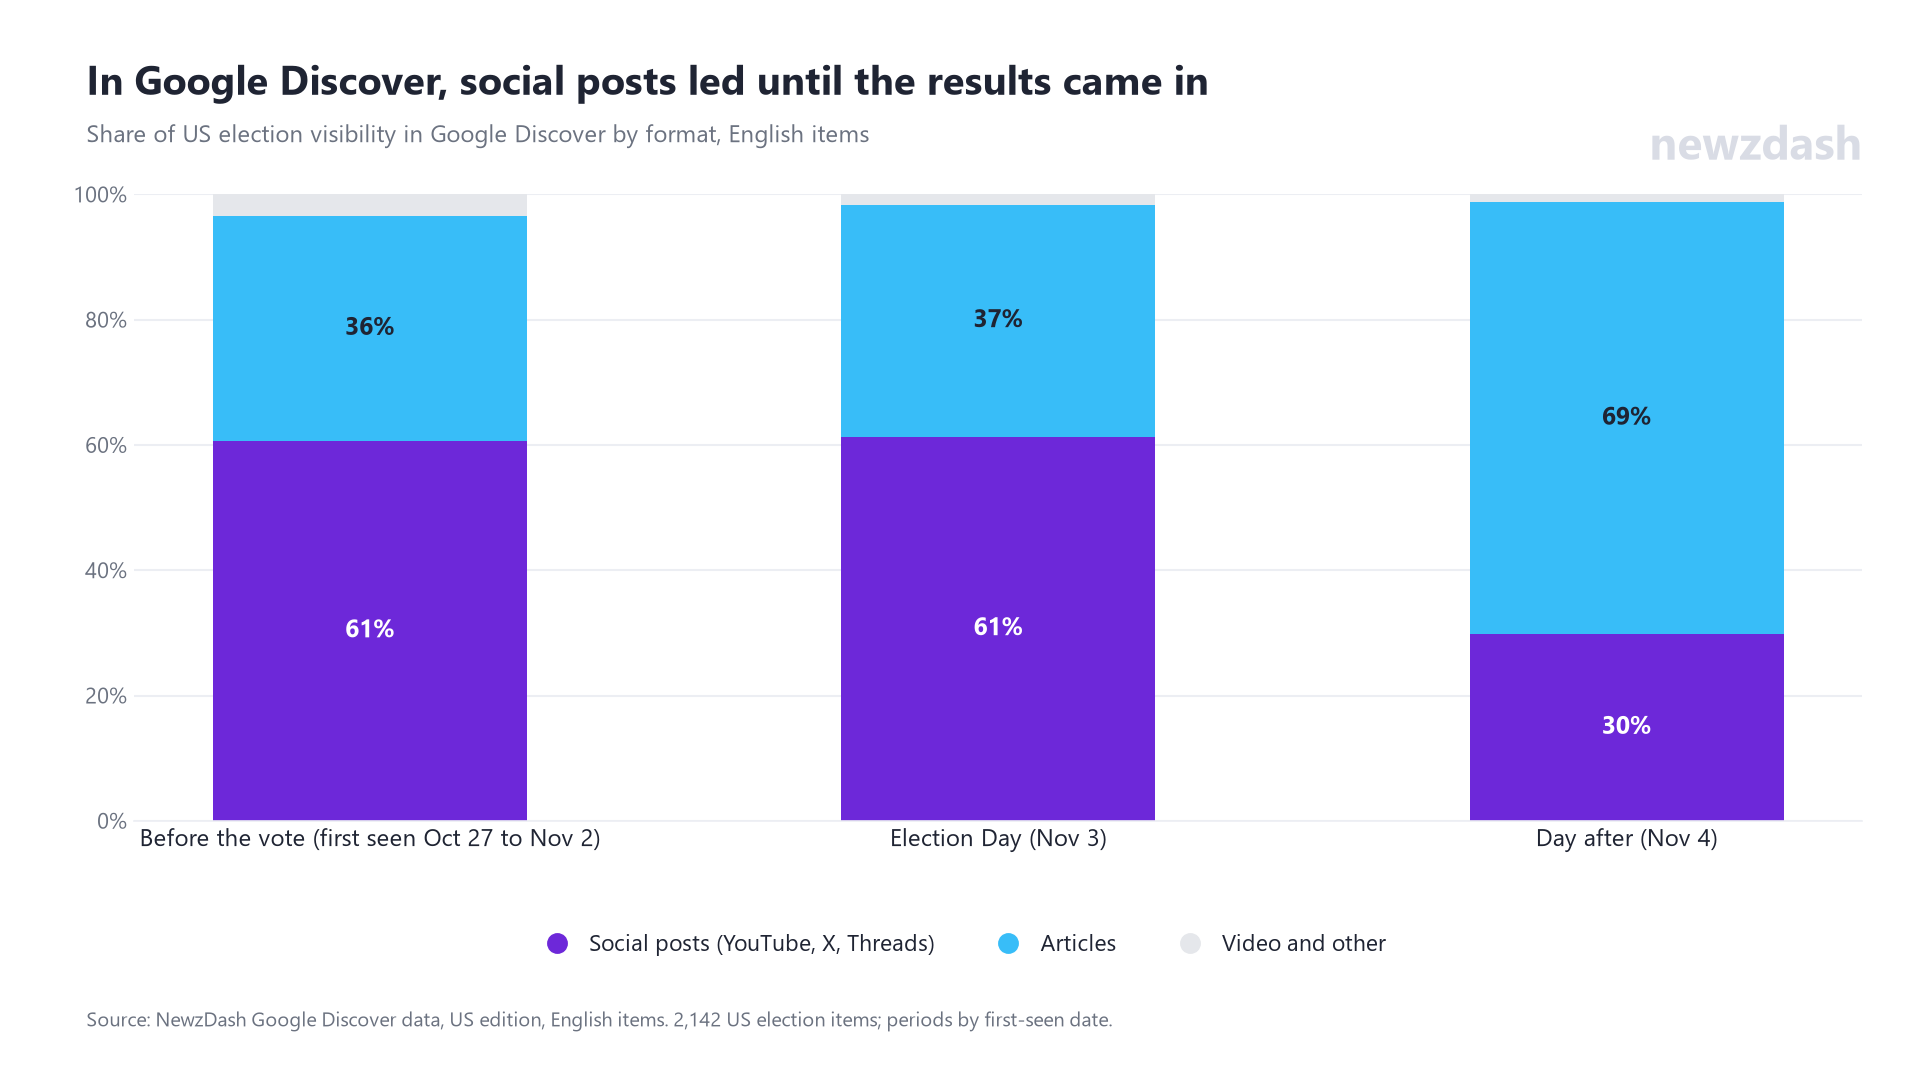
| Period (by first seen) | Social posts | Articles | Leading platform |
|---|---|---|---|
| Before the vote | 61% | 36% | YouTube 45% |
| Election Day | 61% | 37% | X 52% |
| Day after | 30% | 69% | Web articles 70% |
The leaders were not newsrooms. A single satirical YouTube post from The Onion took 13.9% of election visibility for the whole period. Jimmy Fallon's account took 34.7% of Election Day. The day after, newsrooms returned, led by ABC7 Chicago, with a post calling the Florida Senate race, the Guardian, the Times, CNBC and NBC News.
One satirical post from The Onion took 13.9% of all election visibility in Google Discover.
Among web articles only, the Discover ranking shifted from Top Stories:
| Domain | Discover | Top Stories |
|---|---|---|
| New York Times | 11.7% | 10.0% |
| NBC News | 11.1% | 9.9% |
| CBS News | 10.0% | 2.6% |
| Guardian | 9.8% | 4.1% |
| CNN | 9.3% | 3.6% |
| Reuters | 0.6% | 2.6% |
CBS News, the Guardian and CNN did 2.4 to 3.8 times better in Discover than in Top Stories. In our January roundup of 20 news SEO experts on 2026 trends, we framed Discover as an accelerator, not a foundation. The midterms bear that out.
Google Discover: the top social channels on X and YouTube
Social posts drove 56% of US election visibility in Discover, almost all of it from two platforms. YouTube held 33.1% of all election visibility, from 622 posts across 175 channels. X held 21.3%, from 189 posts across 96 accounts. Here are the top 10 channels on each. Shares are of each platform’s election visibility in Discover.
| # | X account | Share of X | Posts | YouTube channel | Share of YouTube | Posts |
|---|---|---|---|---|---|---|
| 1 | @FallonTonight | 33.7% | 3 | The Onion | 42.0% | 1 |
| 2 | @FoxNews | 14.7% | 8 | NBC News | 20.6% | 42 |
| 3 | @Sachinettiyil | 13.1% | 5 | CBS News | 19.7% | 62 |
| 4 | @VaticanNews | 11.8% | 1 | ABC7 Chicago | 6.8% | 3 |
| 5 | @GettyImagesNews | 6.2% | 2 | CNN | 1.2% | 18 |
| 6 | @CBSNews | 4.4% | 30 | KMBC 9 | 0.8% | 12 |
| 7 | @IGN | 2.2% | 1 | C-SPAN | 0.7% | 8 |
| 8 | @BBCAfrica | 1.7% | 1 | WUSA9 | 0.5% | 15 |
| 9 | @Forbes | 1.2% | 2 | WPLG Local 10 | 0.4% | 17 |
| 10 | @PaulRudnickNY | 1.1% | 2 | ABC News | 0.3% | 12 |
Social Discover was won by single posts, not by volume. One Onion post took 42% of YouTube’s election visibility, and three posts from Jimmy Fallon's account took a third of X’s. CBS News published the most: 30 posts on X and 62 on YouTube. That volume earned it 4.4% of X, but 19.7% of YouTube, where it was the third-largest channel.
On YouTube, NBC News and CBS News were the only newsrooms with real weight, holding 40% of the platform’s election visibility between them. Local TV filled out the list: ABC7 Chicago, KMBC 9 in Kansas City, WUSA9 in Washington and WPLG Local 10 in Miami.
What this means for publishers: on YouTube, consistent posting by NBC News and CBS News built a lasting share. On X, Discover rewarded a handful of viral posts, and most newsroom accounts barely registered.
Publishers covered Trump. Searchers asked how to vote.
Before Election Day, we compared what people searched with what the midterms headlines covered.
| Topic | Share of search demand | Share of headline coverage |
|---|---|---|
| How to vote | 47.9% | 2.7% |
| Races and candidates | 19.7% | 11.1% |
| General midterms framing | 19.8% | 50.6% |
| Trump and the administration | 0.6% | 20.4% |
Demand is the share of Google Trends search volume. Coverage is the share of headline keyword days in our midterms feed. The units differ, so read this as direction, not precision.
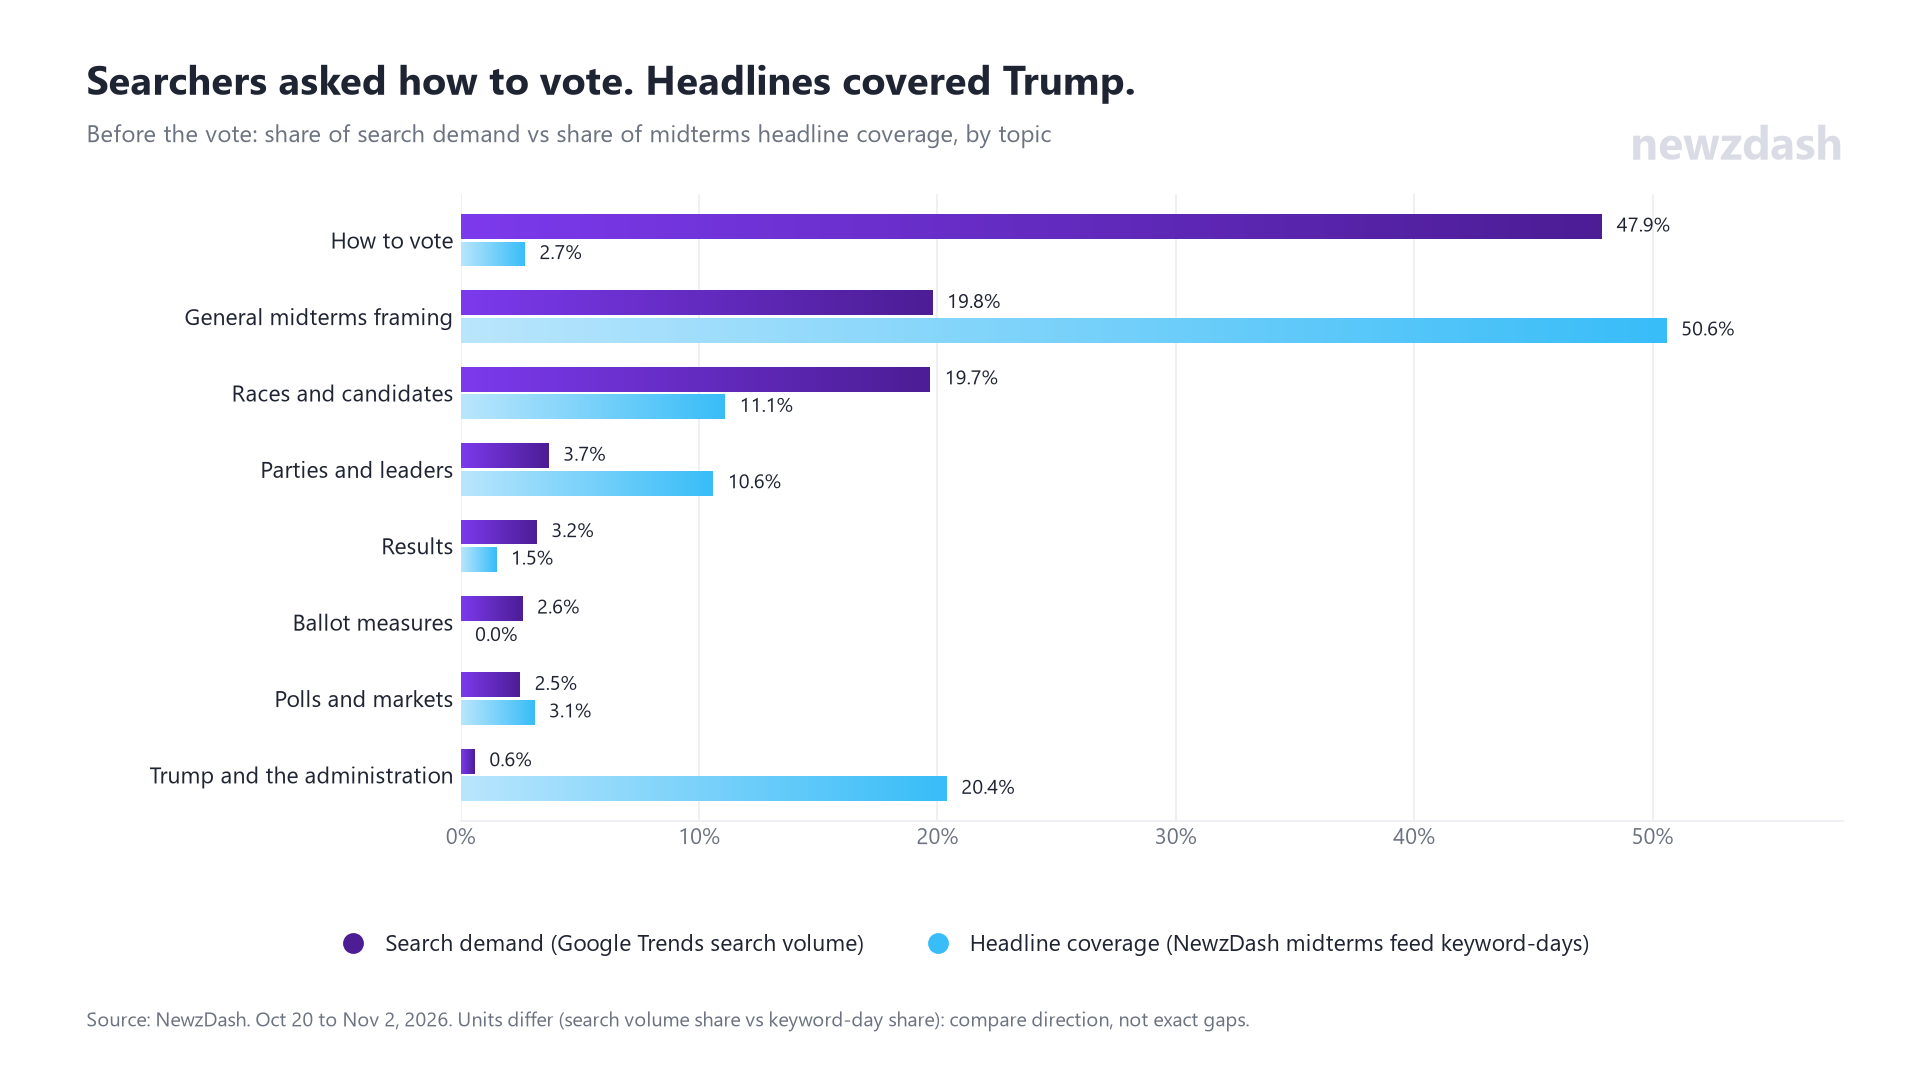
Nearly half of pre-election search demand was practical: when to vote, where, and whether you are registered. Headlines barely served it. A fifth of headline keywords were about Trump, a topic that drew under 1% of searches. Ballot measures drew 2.6% of demand and almost no coverage, even as "prop 40" trended for eight days.
48% of pre-election search demand was about how to vote. Only 3% of midterms headline keywords covered it.
More findings from the data
These findings did not need a section of their own, but they are worth having.
Topic winners in Top Stories (whole period):
| Topic | Leaders |
|---|---|
| Results | NBC News 19.5%, NYT 16.9%, Washington Post 4.6% |
| Races and candidates | NBC News 12.0%, NYT 10.8%, Washington Post 3.4% |
| How to vote | CBS News 8.5%, NYT 6.7%, USA Today 3.5% |
| Polls and prediction markets | NYT 10.5%, Reuters 8.1%, NBC News 7.9% |
| Parties and leaders | NYT 8.3%, CNN 7.9%, NBC News 6.0% |
| Trump and the administration | Guardian 6.6%, NBC News 6.4%, CNN 4.8% |
| Ballot measures | LA Times 24.3%, Maryland Matters 7.9%, Patch 7.3% |
Top Stories by keyword set:
| Period | Headline keywords (midterms feed) | Trending searches (Google Trends) |
|---|---|---|
| Before the vote | NYT 7.4%, Guardian 5.8%, CNN 5.4% | CNN 8.4%, NYT 8.2%, The Atlantic 5.0% |
| Election Day | NYT 9.5%, NBC News 9.1%, Guardian 8.5% | NBC News 14.0%, NYT 9.0%, CBS News 4.9% |
| Day after | NBC News 10.9%, Guardian 8.7%, NYT 8.4% | NBC News 16.7%, NYT 14.9%, Washington Post 4.5% |
- The long tail is long, and thin. 2,139 domains appeared in Top Stories over the period. 47% of them appeared three times or fewer. The top ten domains held 43% of all visibility.
- The Guardian is a headline-keyword publisher. It ranked third on the midterms feed on Election Day (8.5%) but did not make the top five on trending searches.
- AI Overviews swung daily before the vote. On headline keywords they appeared on 21% to 45% of checks per day.
- Discover's election topics centered on Trump. He appeared on 42% of election visibility in Discover, followed by the House (11%), US senators (11%) and the Alaska Senate race (6%).
- Spanish-language Discover had its own leaders. About 6% of US election visibility in Discover came from Spanish-language items, led by CNN en Español, ABC (Spain) and Noticias Telemundo. This article's Discover figures cover English only.
- Discover items lived about a working day. Median lifespan was 8 to 13 hours depending on format.
- Search interest rarely outlived a day. Only two election keywords trended for more than four days: "prop 40" (eight days) and "voting near me" (seven).
What changed since 2024
The keyword sets differ from our 2024 election winners and losers analysis, so treat these comparisons as directional.
In 2024, CNN led Top Stories over 30 days (6.31%), and the Guardian led on Election Day (6.89%). In 2026, CNN finished eighth on Election Day and the Guardian fifth.
The LIVE label has grown. In 2024, 4% of Top Stories results carried it. In 2026 the pre-election level was similar, at 4.5%, but on Election Day it reached 22.7% of Top Stories results, five times higher.
Final take
The 2026 midterms did not reward the publisher with the most election stories. They rewarded the publisher that owned the 72 hours when demand arrived, with live pages that stayed fresh and results pages built before polls closed. NBC News did that across Top Stories, LIVE and organic. Most of its competitors were strong on one surface and weak on the next.
Before the next election night:
- Publish how-to-vote content by the eve of the vote. Nearly half of pre-election demand was practical, and most headlines missed it.
- Build results hubs by race and state before polls close. The biggest searches came the morning after.
- Run one persistent live page per race cluster. Live formats outranked standard articles, and the LIVE label covered 85% of results pages the day after.
- Put election video on YouTube. YouTube held 74% of video visibility the day after, and newsroom sites barely registered.
- Assign local race coverage early. Local outlets won their own states' races against national brands.
- Track each surface separately. Your Top Stories rank says little about organic, video or Discover.
- Plan Discover around social formats. Social posts held 56% of election visibility there.
You can follow these surfaces for the midterms on our 2026 US midterm elections dashboard.